
Recording and Replaying Telemetry Data
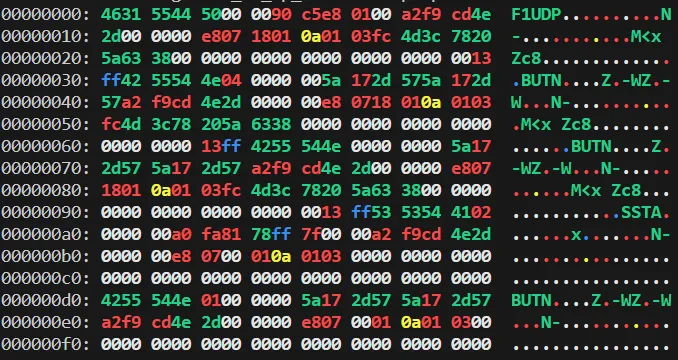
Smarter Telemetry Debugging for Pits n’ Giggles
While developing Pits n’ Giggles, my F1 sim racing app, debugging became a serious bottleneck. Every cycle meant:
- Launching the sim
- Triggering a scenario
- Pausing to add logs or breakpoints
- Alt-tabbing back to the IDE
- Restarting the sim
This repeated context switching between game and code slowed me down drastically, and made debugging a dreadful task. And some of the scenarios would be absurd and annoying, like
- DNF and take more than one other car with me in turn 1 (this took more attempts than I’d like to admit)
- Pit on lap 10 at Imola and use flashback just after changing tyres, etc
To solve this, I built two developer tools:
telemetry_recorder- Captures live telemetry from the sim via UDP and writes to a file. Dumb and simple.telemetry_replayer- Replays captured telemetry offline over UDP or TCP
Now, I can record once, and debug forever without ever restarting a race.
Custom Binary Format
Initially, I had considered the standard pcap format where I capture packets, write to a standard pcap file and then replay from this file. The benefit of this approach would’ve been that the file is innately compatible with wireshark.
PCAP format is a highly detailed and verbose format, that captures several nuances of packet traffic, and more importantly, wireshark supports it out of the box. However, the code started become too complex, way too complex for a dev tool. This would’ve required a siginifant chunk of time to develop and test. And since this is just a dev tool, it was not worth the effort.
Hence, a new custom simpler file format was defined, the .f1pcap file.
The format is now at version 2.0. Two things changed since the first version: compression moved from a compressed payload in every block to a single LZMA stream, and packet timestamps grew from float32 to float64. Version 1 files still read unchanged.
File Header (12 bytes)
| Offset | Size | Field |
|---|---|---|
| 0 | 6 | Magic number (F1UDP�) |
| 6 | 1 | Flags byte: bits 3-0 hold the compression mode, bits 7-4 are reserved |
| 7 | 1 | Version byte: bit 7 is endianness (1 = little), bits 6-4 major version, bits 3-0 minor version |
| 8 | 4 | Number of packets (uint32) |
The compression mode is one of:
| Value | Mode | Notes |
|---|---|---|
| 0 | None | Raw packets |
| 1 | Per-packet zlib | The original scheme, still readable |
| 2 | Global LZMA | Default for new recordings |
The reader validates the header up front. It rejects a bad magic number, a truncated header, a major version newer than it understands, and an unknown compression mode.
Packet Data Block
| Offset | Size | Field |
|---|---|---|
| 0 | 8 | Timestamp (float64; float32 in major version 1 files) |
| 8 | 4 | Data length (uint32) |
| 12 | N | Packet data |
In the per-packet modes, the data is the packet’s raw bytes or its zlib-compressed form, and the length field is the stored size. In global LZMA mode, the whole body after the header is one xz stream, and this block framing sits inside the compressed stream with raw packet data.
What I got wrong: a compressed payload in every block
In version 1, every block carried its own independently compressed payload. That seemed natural, since each block is self-contained and easy to read back. It was a costly mistake, for two reasons:
- Every block repeated the compression framing. Each packet was its own zlib stream, so each one paid for its own stream header and checksum (roughly 11 bytes) on top of the 8-byte block header. I first noticed it in tiny test captures of a couple of packets, where the compressed file was actually larger than the raw one. Across a real recording of 10k+ packets, per-packet compression still beat storing raw, so the problem was easy to miss. It was just leaving a lot on the table.
- Nothing was shared between packets. Telemetry is extremely repetitive. Consecutive car telemetry packets differ in a handful of fields, and the game sends a fixed 22-car array even when only a few cars are on track, so the rest is runs of zeros. Per-packet compression can only see one packet at a time, so it never exploits any of that.
Version 2 compresses the body as one LZMA (xz) stream, with the block framing inside it, so the compression header appears once per file instead of once per packet and the compressor sees the whole recording. On my real captures this made files about 2.6x smaller (a 6.0 GB test corpus dropped to 2.0 GB), which for a tool whose recordings are measured in hundreds of MB per hour is the whole game. Reads are incremental, so a recording cut off mid-write still yields every complete packet instead of failing outright.
The lesson: when the data is a stream of similar records, compress the stream, not the records.
The timestamp bug hiding in plain sight
I found the second problem while estimating how big an hour-long, 20-driver recording would be. Timestamps were stored as float32, which keeps only 24 bits of precision. Epoch seconds are around 1.79 billion, which needs 31 bits to write as an integer, so the low 7 bits are thrown away. That leaves a resolution of 2^7 = 128 seconds: the only values a float32 can hold up there are multiples of 128, and everything in between rounds to the nearest one. The first 2000 packets of a real capture all carried the identical timestamp, so a 50-minute session held only about 23 distinct values. The recording had effectively no inter-packet timing at all. Version 2 stores float64, which costs 4 extra bytes per packet (about 0.7% of the file) and gives sub-microsecond resolution. And to be honest, I never really needed the timestamp until that day. I have always done my debugging by replaying the recordings at max speed (TCP mode) This was why such an obvious issue was missed (well, that’s my excuse).
The takeaway is the same in both cases: I had never looked closely at the bytes the format was actually writing. Measuring real files, instead of trusting the design, is what exposed both. I wrote the code, did round-trip tests. And when I got them to pass, I moved on.
Telemetry Recording Workflow
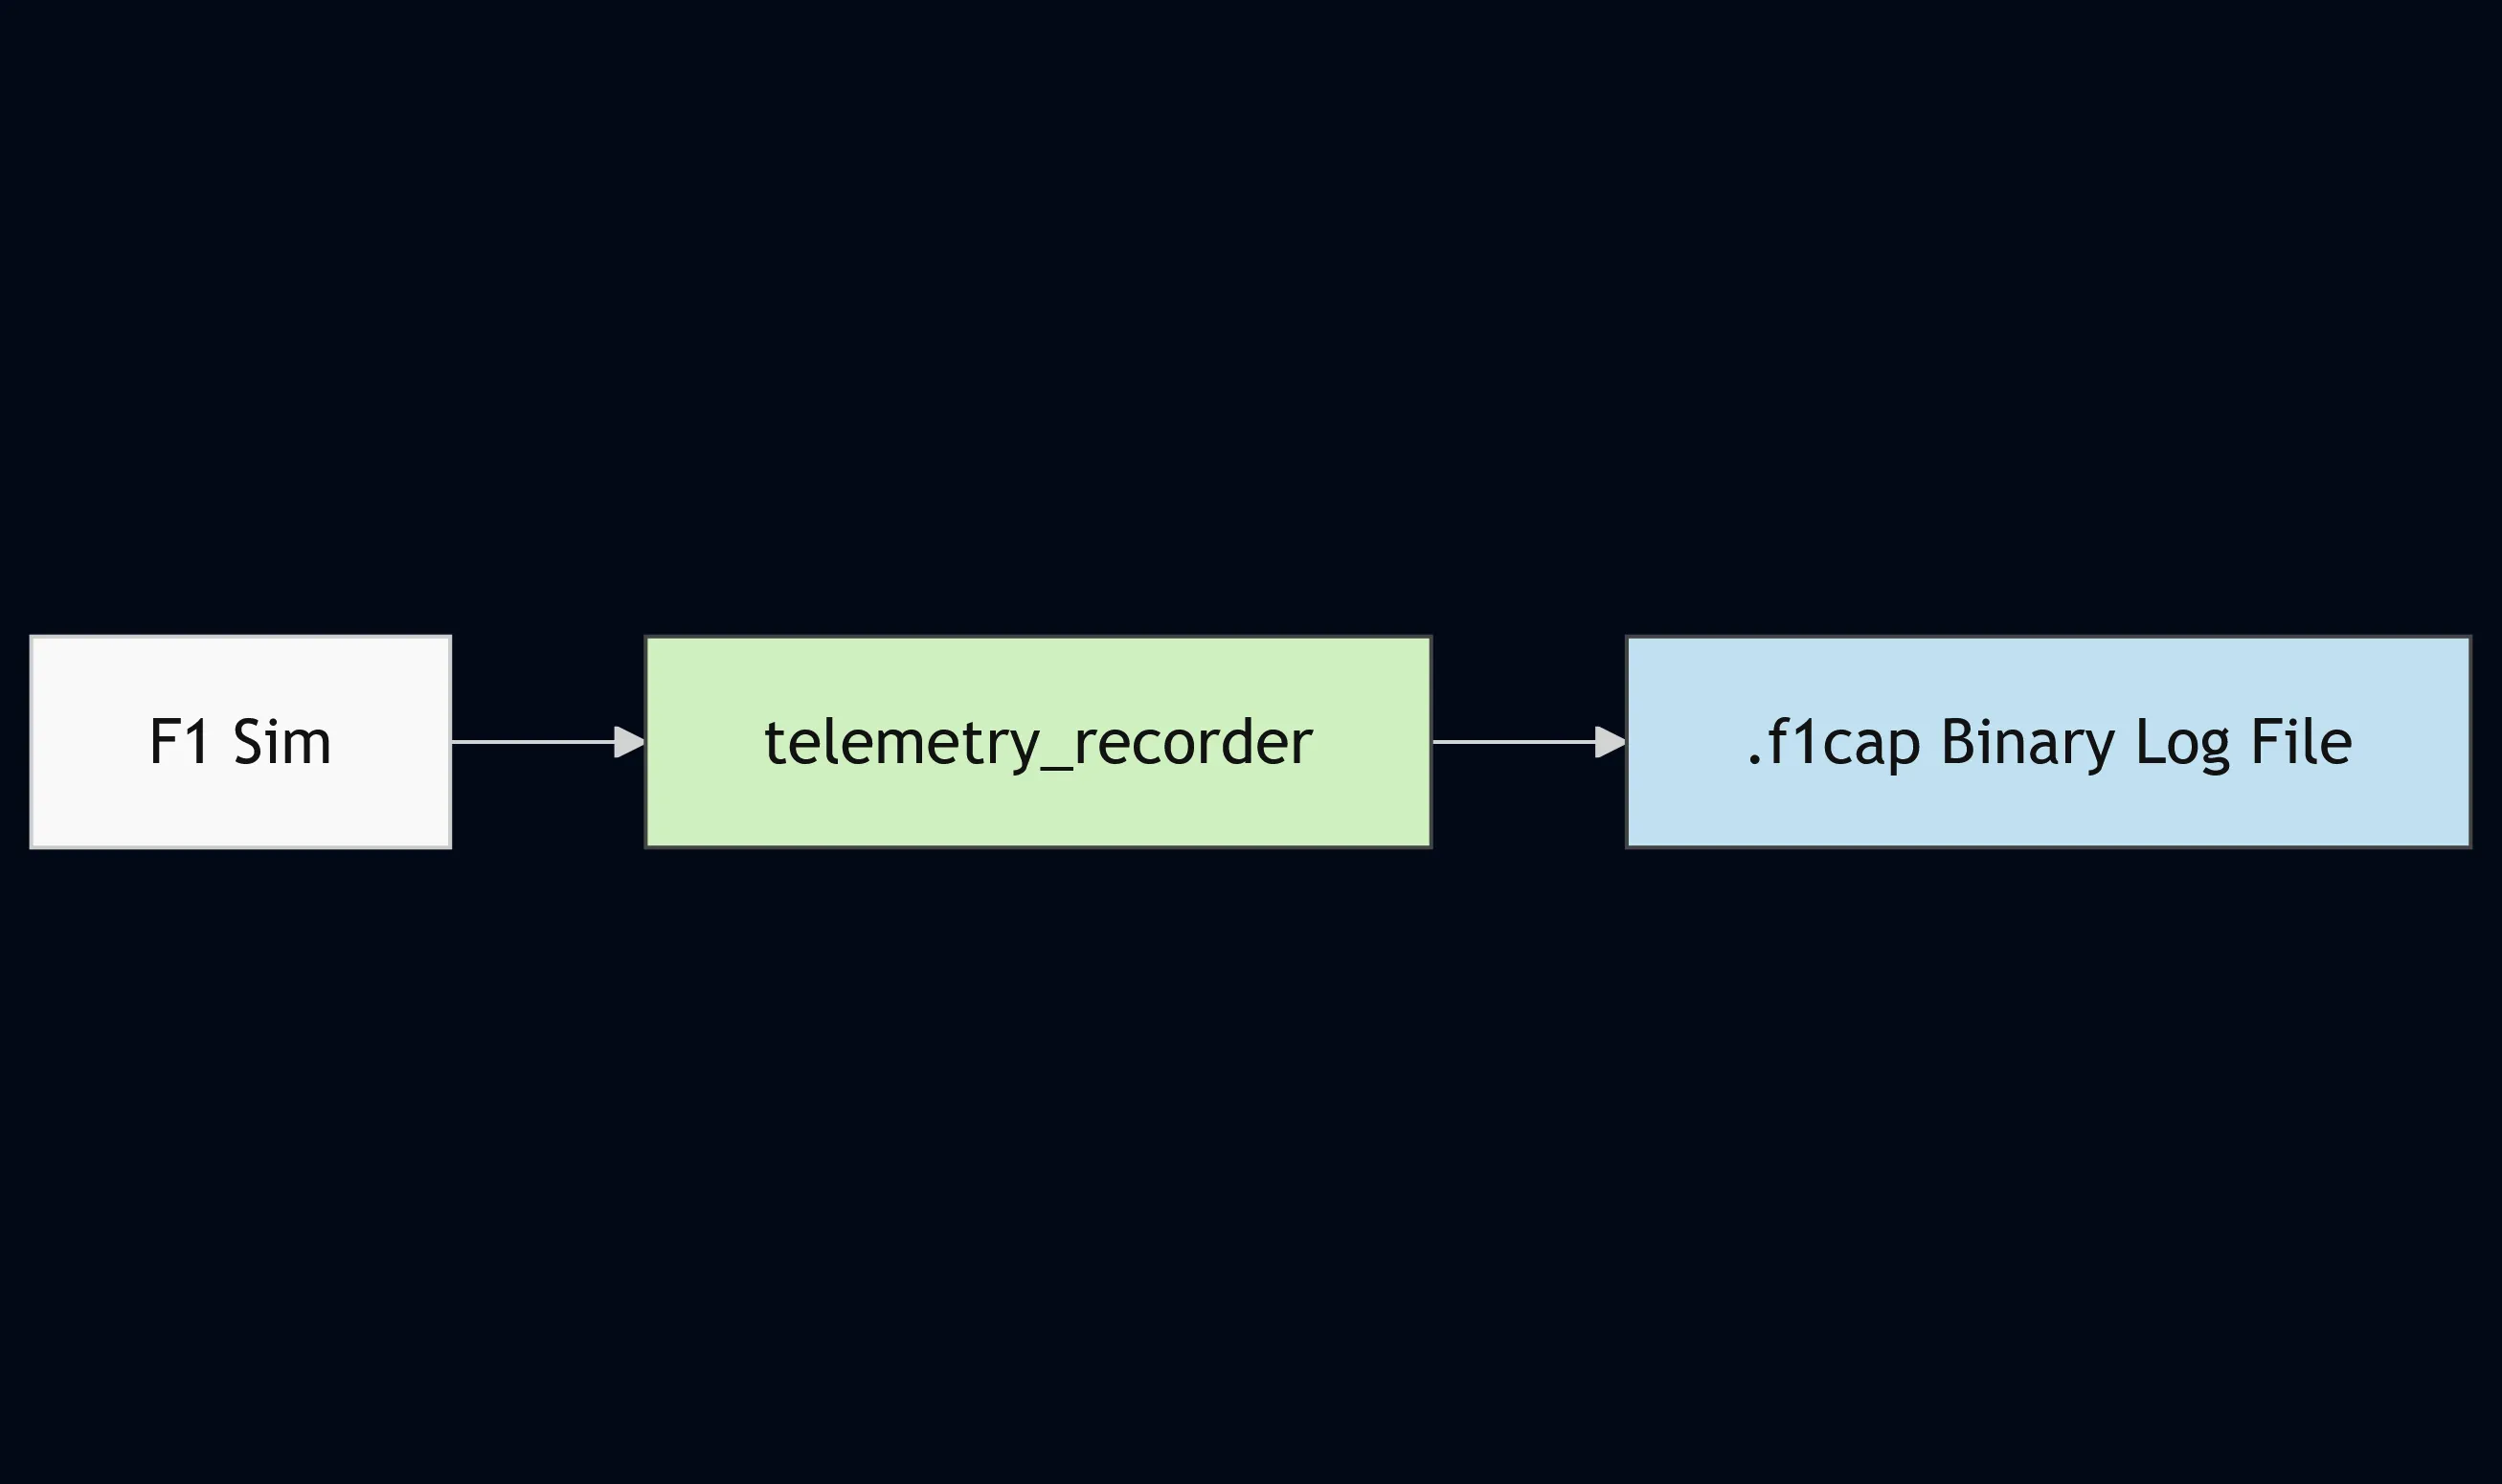
Telemetry Recording Process
- Captures all UDP telemetry during a live sim session
- Timestamps and serializes each packet into a structured binary file
- Optional compression (global LZMA by default) selected via the header flags
- Can be versioned, archived, and reused
Telemetry Replay Workflow
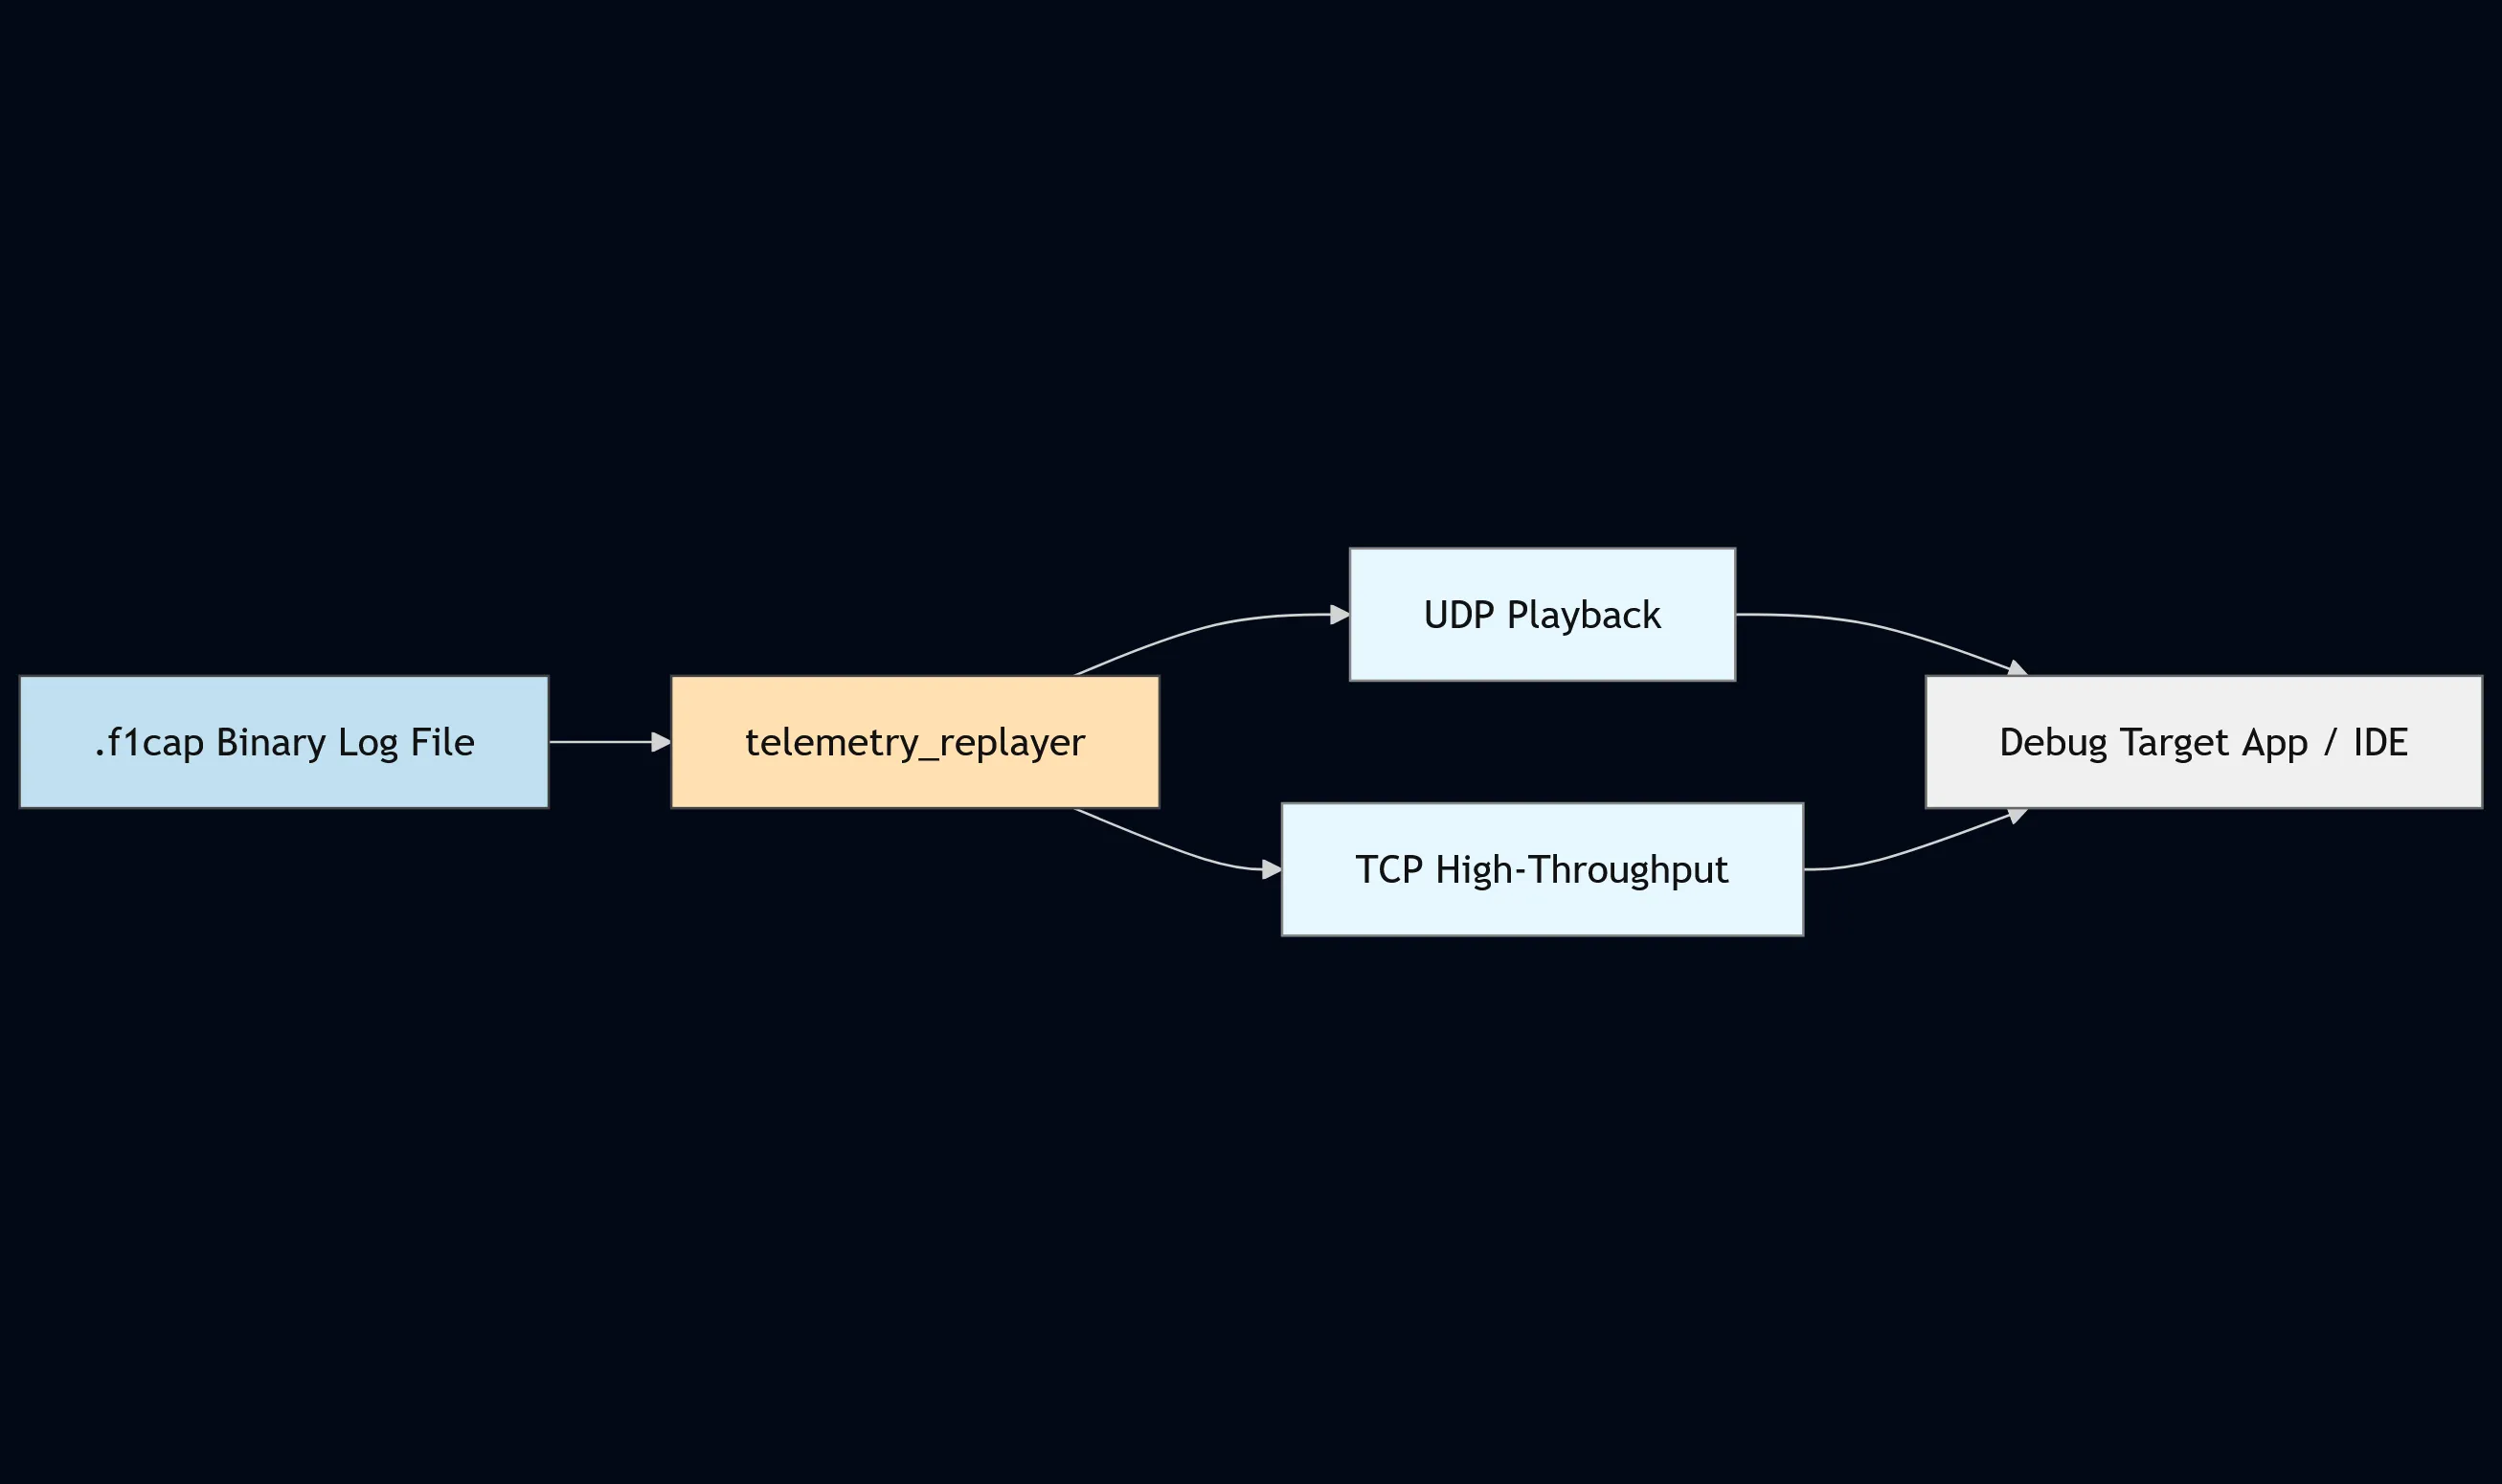
Telemetry Replay Process with UDP and TCP Modes
- Replays saved sessions as if they were live
- Supports playback speed multipliers
- TCP mode enables reliable high-throughput for stress testing (via congestion control)
- Can be run repeatedly for test automation or regression
From Mental Overhead to Focused Flow
Before these tools:
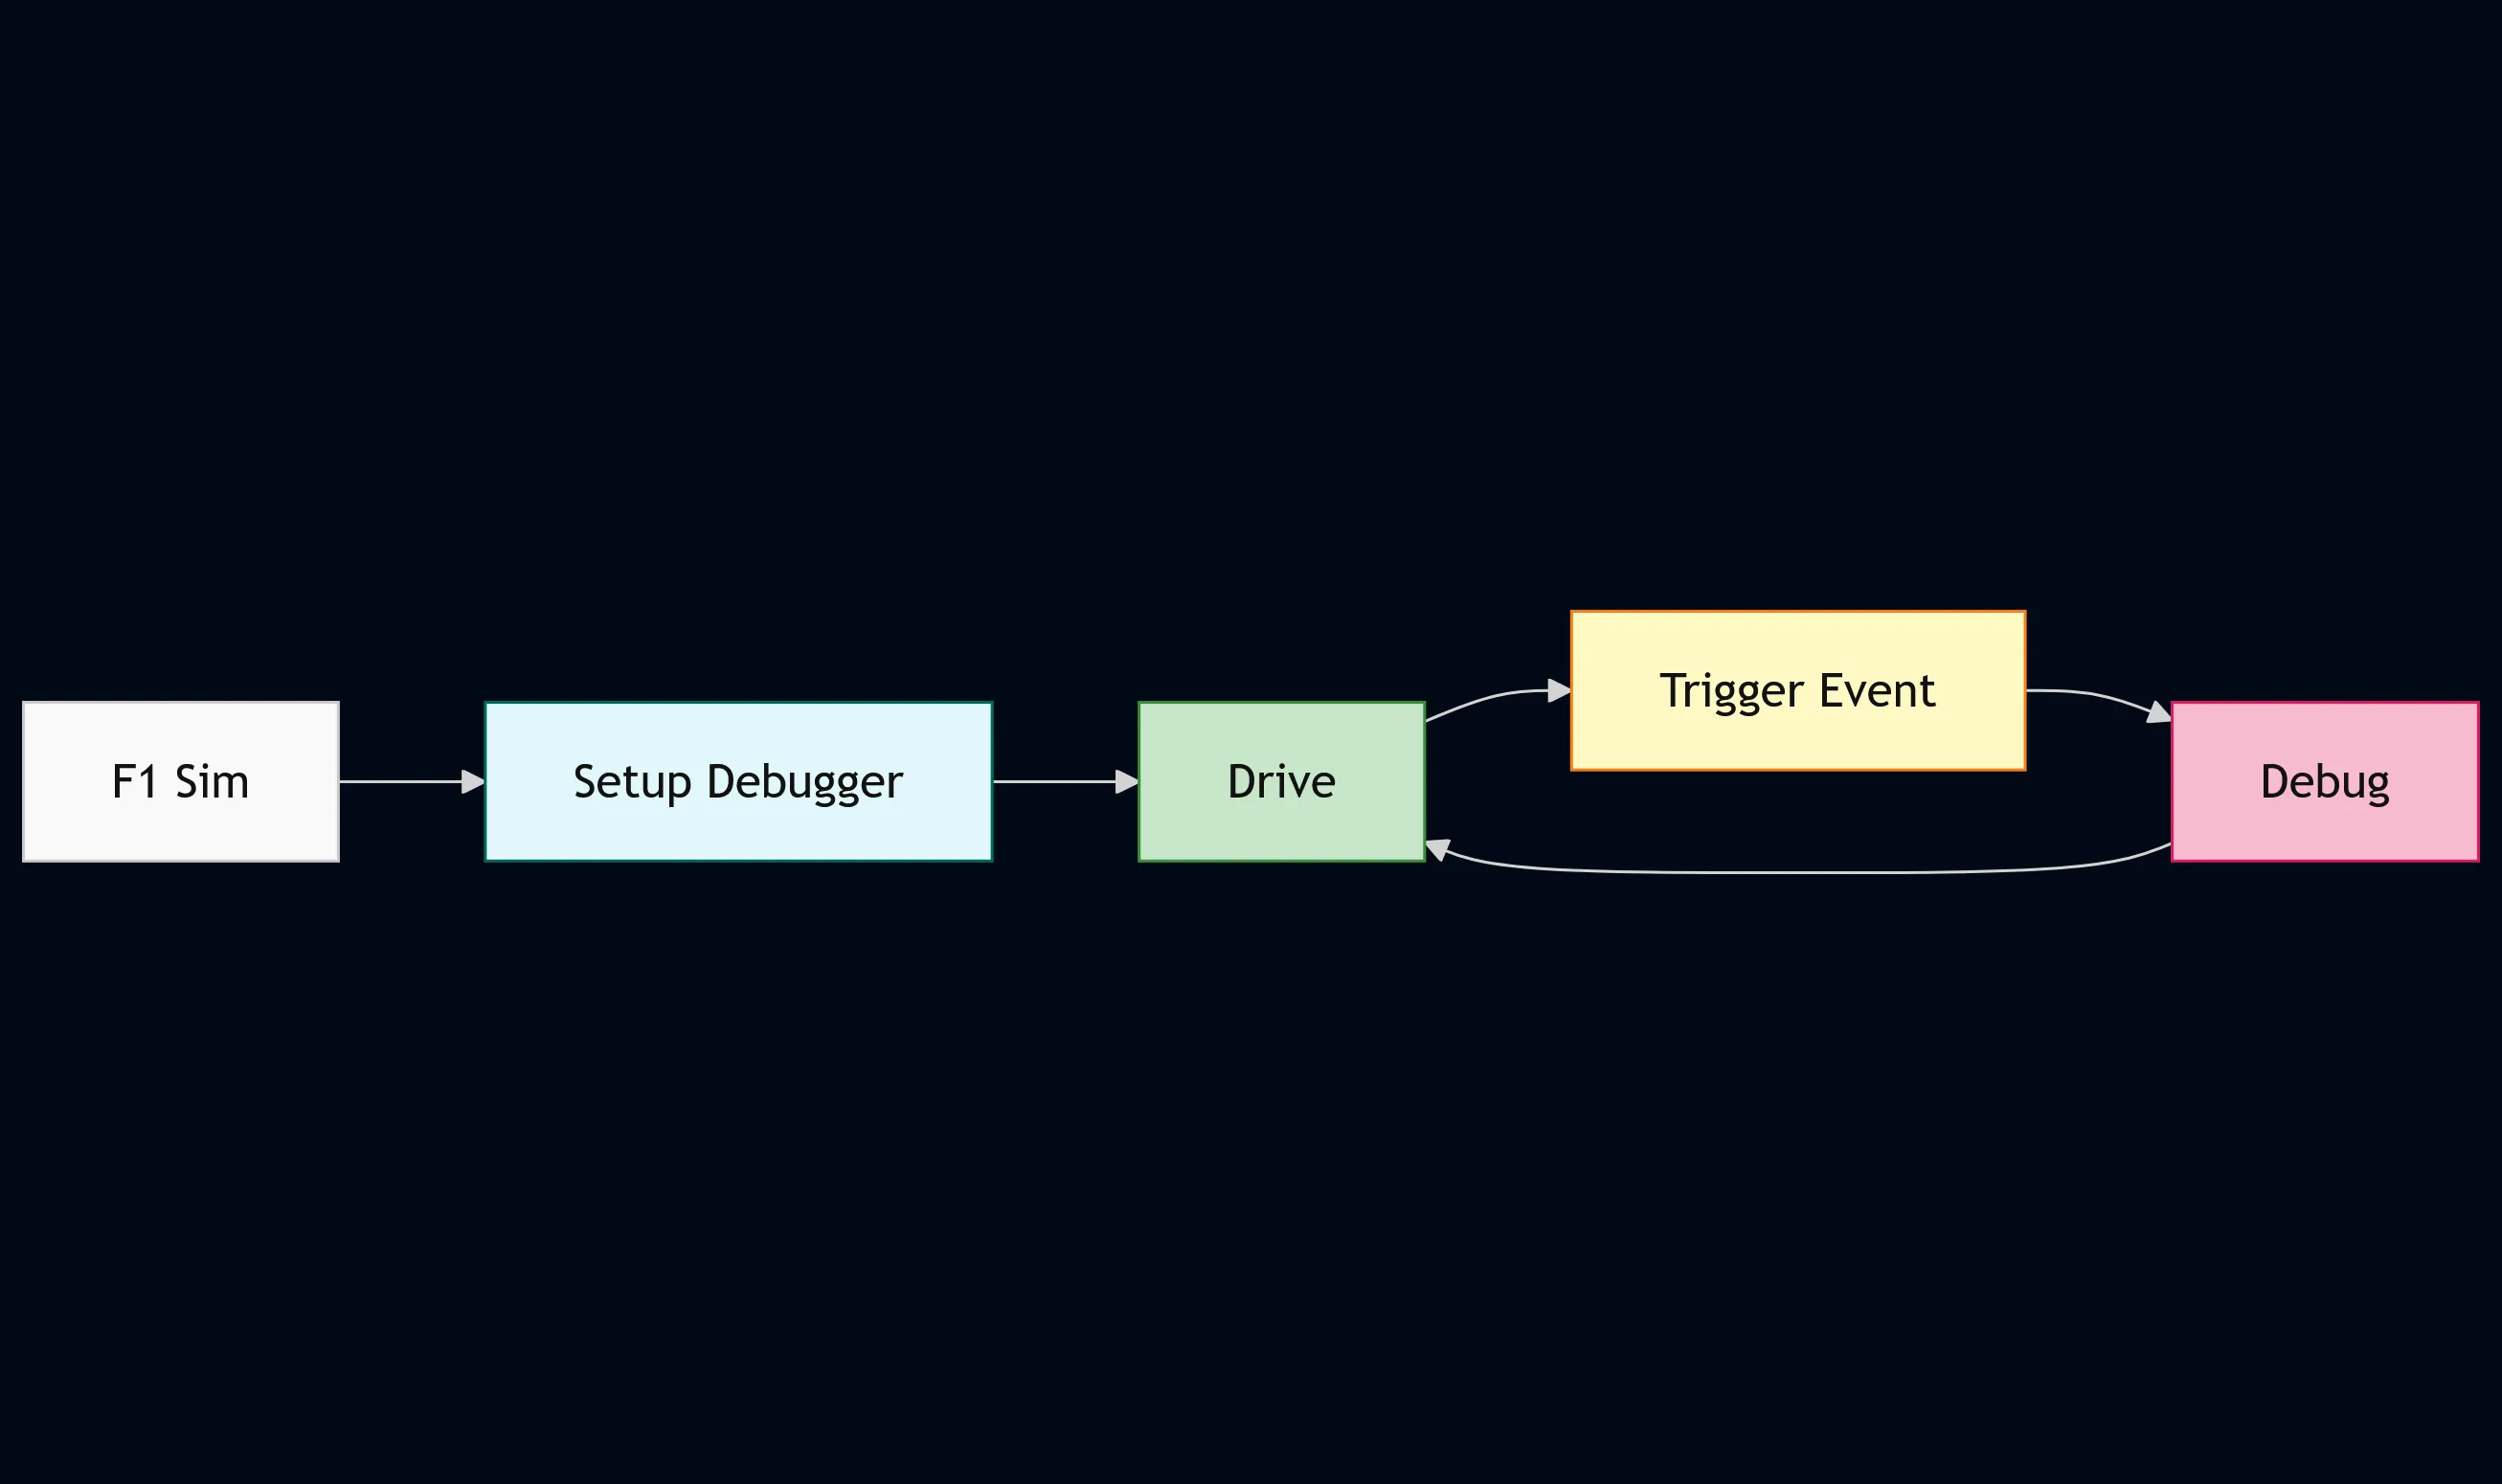
- High friction
- Lost focus
- Slower iteration
Now:
- No sim restarts
- No context switching
- Full control over playback and timing
Feature Highlights
- Record once, debug forever
- Replay saved sessions at any speed
- TCP mode for high-fidelity stress tests
- Optional LZMA compression for large captures, with truncated files still readable
- Versioned binary format (now 2.0) with endianness and compression-mode support
- Reduced mental overhead = faster iteration and fewer bugs
Wrap-up
By decoupling live simulation from debugging, telemetry_recorder and telemetry_replayer have dramatically improved how I develop Pits n’ Giggles. It’s one of those internal tools that paid for itself almost instantly and continues to save me hours every week.
I’m happy with the end result and with how much mileage I’ve got out of this tool. Would have I done anything differently given everything I’ve learned since then? I would’ve compressed the stream instead of each packet from day one, and used a float64 timestamp. I’d also have added a checksum field to the header, making the file more robust, and also making the header a nice satisfying 16 bytes. For a dev tool, I think this does the job as is.
If you’re building anything real-time or stream-based, building a similar telemetry pipeline will radically simplify your workflow. Trust me, you’ll thank me later